Niche Decode – The Etsy Buying Decision Happens in the Grid
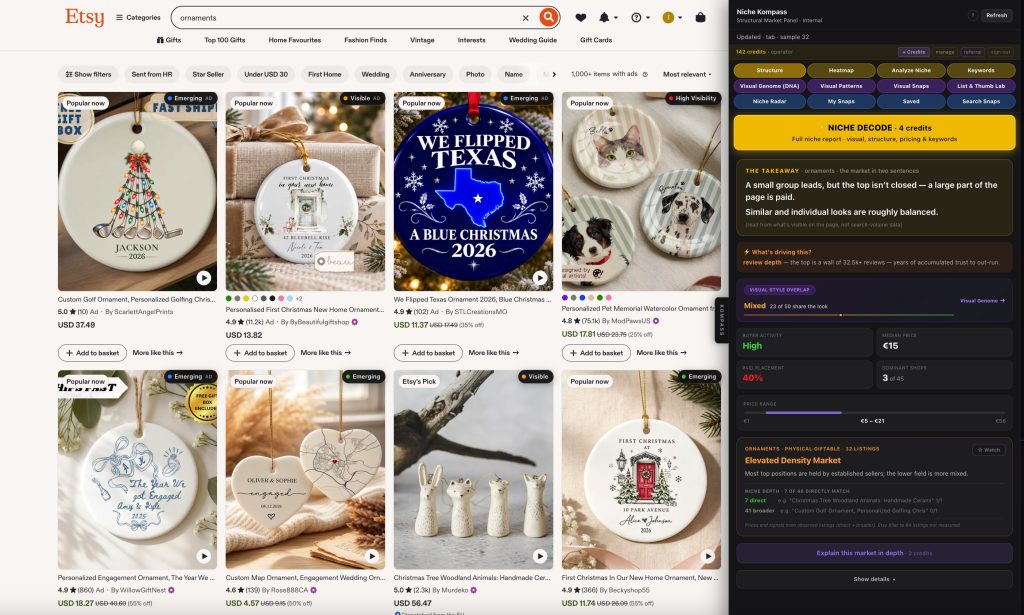
Every Etsy seller knows this screen. The stats say people are finding you. Views come in, day after day. Sales don’t. The standard advice is predictable: more keywords, better tags, longer titles. Sometimes that’s the right fix. Most of the time it isn’t.
“Views but no sales” is rarely an SEO problem. The buyer found you. They compared you. Then they chose someone else. That comparison happens in one place: the search grid — a wall of small thumbnails, side by side, each making the same promise. The buyer scans it in seconds and clicks whatever reads as the right thing, done well.
The buying decision happens in the grid. Let’s look at it.
Three Grids, Measured
Why the Grid Decides
Three niches, three completely different situations. In ornaments, 92% of thumbnails follow one archetype, yet only 23 of 50 share the exact look: the same formula, executed individually. Family Christmas shirts is a near-uniform wall. In Gothmas, the market hasn’t settled on a visual language at all.
-
What keyword tools missMost Etsy research tools answer what people type, how many listings compete and how much demand there seems to be. Useful questions — but they stop exactly where the buyer starts deciding. None of them show what the market looks like: the palette that dominates, the photo style everyone defaults to, how uniform the grid has become.
-
Belong, but be differentEvery thumbnail has two jobs that pull in opposite directions. It has to belong — the buyer must recognise instantly that this is what they searched for. And it has to differ — if it looks like the 40 listings around it, nothing tells the buyer why this one. Hitting that balance by instinct is hard. Hitting it with data about the actual grid is a design brief.
-
Why it mattersA listing that looks clearly different in a uniform grid is a hypothesis worth testing, not a guaranteed win. But it is a far better starting point than designing blind and finding out three months later. That visual layer is what Niche Kompass reads.
Visual Genome (DNA)
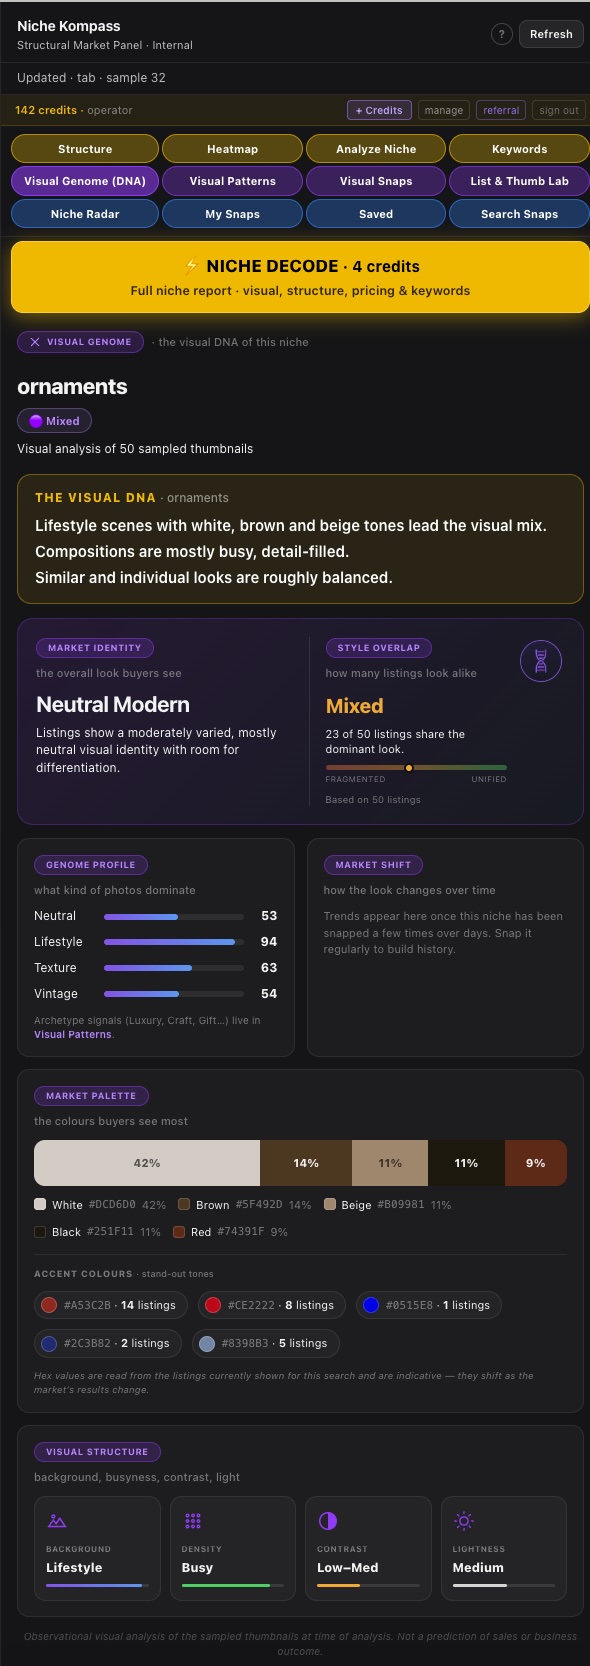
Remove the titles and shop names, and a niche still has a face. Visual Genome reads it.
-
What it showsThe niche’s visual identity: the dominant palette with exact HEX codes, the prevailing style, backgrounds, composition and lighting — measured across the thumbnails buyers actually see.
-
Key signalIn ornaments today: Neutral Modern identity, Mixed style overlap (23 of 50 share the dominant look), and a palette led by white #DCD6D0 at 42%, then brown #5F492D, beige #B09981, black #251F11 and red #74391F. Lifestyle scenes score 94 — busy, detail-filled compositions dominate.
-
Why it mattersYou know the market’s colour code before you design for it — what to keep so you belong, and where a different palette would read at a glance.
Visual Patterns
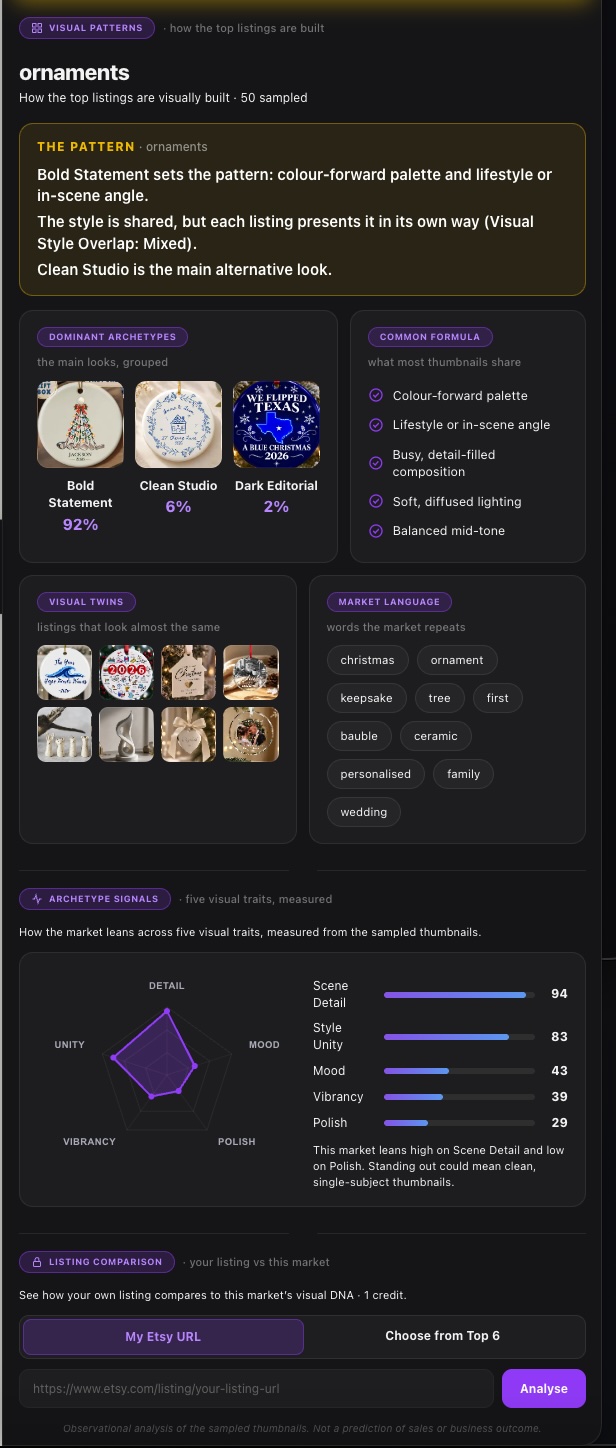
Every grid repeats a formula. Visual Patterns names it and measures it.
-
What it showsWhich thumbnail archetypes dominate and by how much, the visual “twins” that repeat across shops, and the trait signals behind them — scene detail, polish, mood, vibrancy, style unity.
-
Key signalBold Statement at 92% in ornaments (94% in family Christmas shirts): one archetype owns the grid, with Clean Studio as the main alternative at 6%. The trait signals show the shape of it — Scene Detail 94, Style Unity 83, but Polish only 29. A clean, single-subject thumbnail in that grid is a testable idea, not a guaranteed win.
-
Why it mattersInstead of hearing “your photos need work,” you see the formula your buyer compares you to — and which traits the market under-uses.
Structure & Heatmap
The look of a market is half the picture. The other half is who holds it — and how.
-
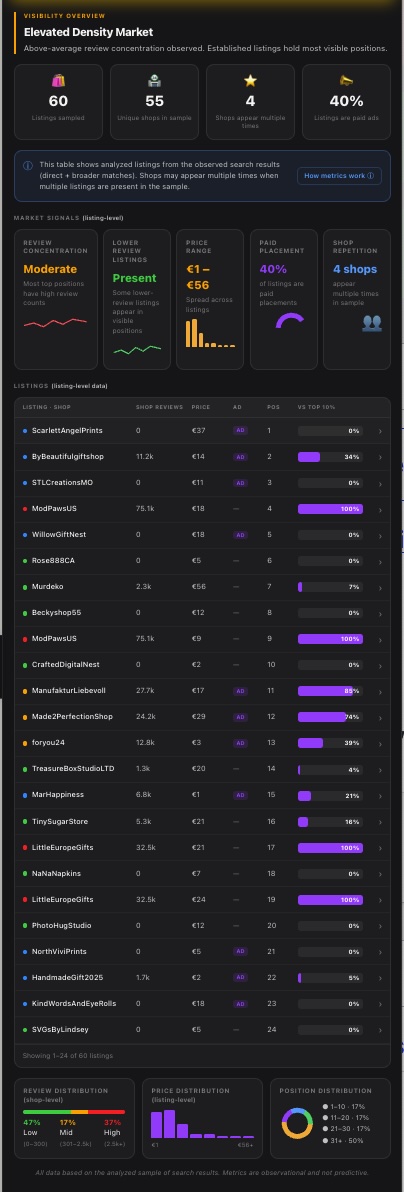
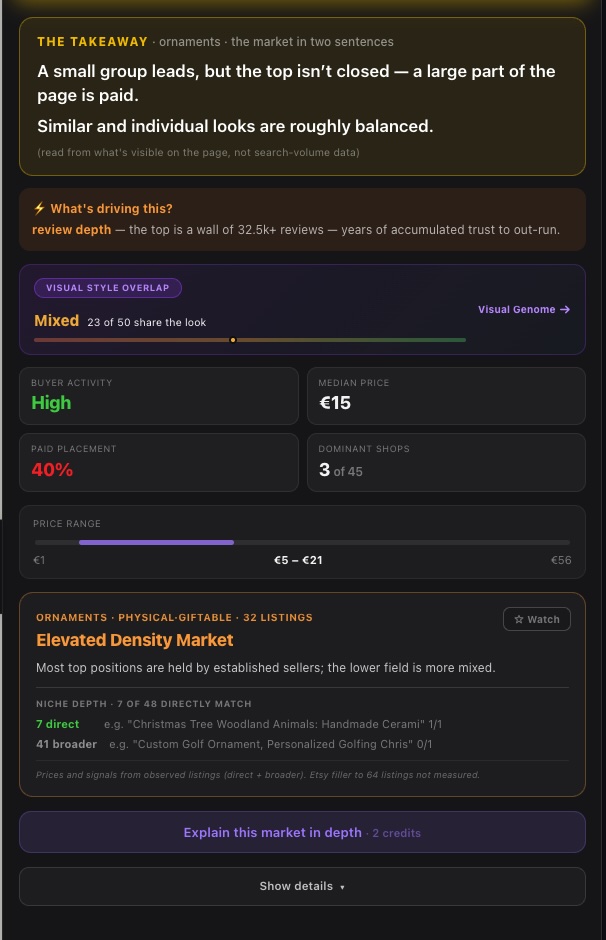
What it showsMarket density, median price and price spread, review depth at the top, repeat shops, and the share of paid placements — mapped position by position across the results.
-
Key signalOrnaments: Elevated Density, 40% paid placement, a median price of €15 with the core between €5 and €21, and a review wall of 32.5k+ at the top. Family shirts ran at 15% paid. Two holiday niches, two very different ways visibility is being won.
-
Free on StarterStructure and Heatmap are free to use on any Etsy search.
List & Thumb Lab
From reading the market to your own listing — in the same panel.
-
What it doesBring your own product photo and get a listing blueprint read against the niche you’re entering.
-
What you getA thumbnail diagnosis, a styling recipe, a ready title, missing tags and a palette.
-
Why it mattersThe market data stops being abstract. It becomes a concrete brief for the one thumbnail that has to win the grid.
Visual Snaps
Etsy search is live. A grid you read today is not the grid of next month.
-
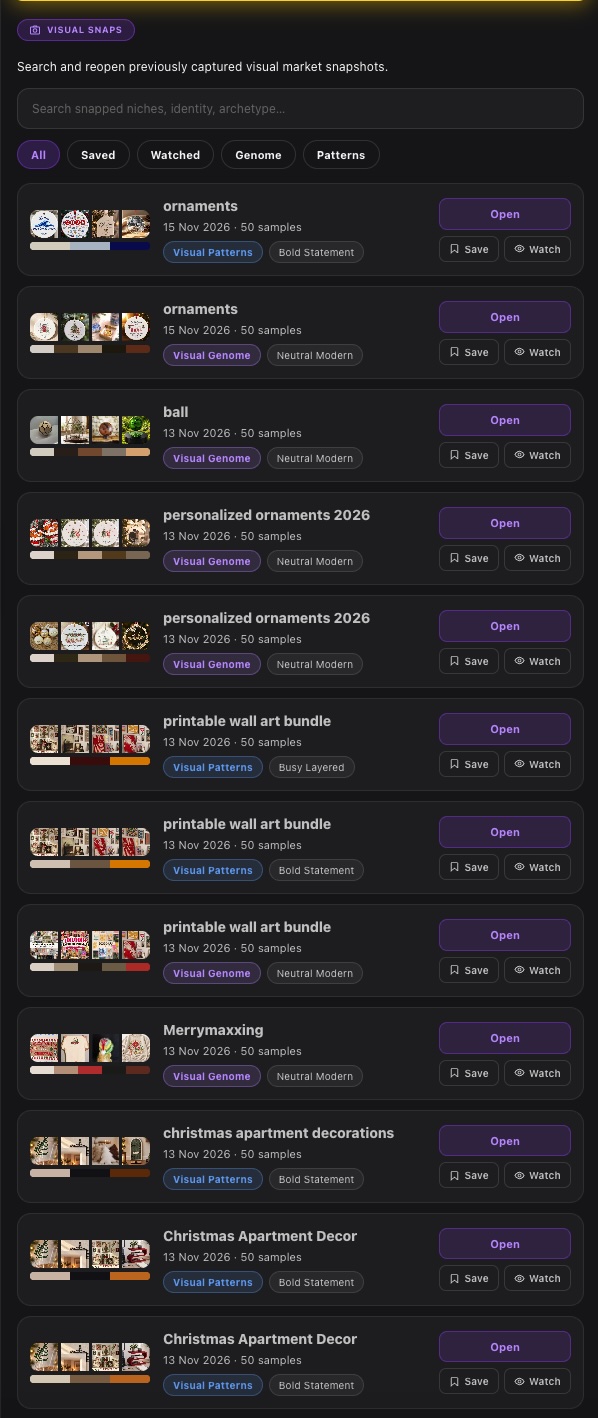
What it doesEvery read is saved automatically, so you can watch a niche change over time instead of judging it from one afternoon.
-
Why it mattersEvery number in this article is a point-in-time snapshot. Snaps turn single snapshots into a trend — when a look starts to crowd, or a lane opens up.
What It Doesn’t Do
Niche Kompass shows you the market as it stands. You make the decision. That’s the point.
Start free with the Starter plan: Structure and Heatmap on any search, plus one full Visual Genome and Visual Patterns read of your niche and 2 credits, on the house. You only enter your Etsy shop name — no account connection, no Etsy login.
For regular work, a subscription gives you credits at a much lower price per credit.
Etsy is a trademark of Etsy, Inc. Niche Kompass is an independent tool and is not affiliated with or endorsed by Etsy.